📦 Where Australia Loses $2 Billion in Freight Every Year
Check out the interactive map →
Company News
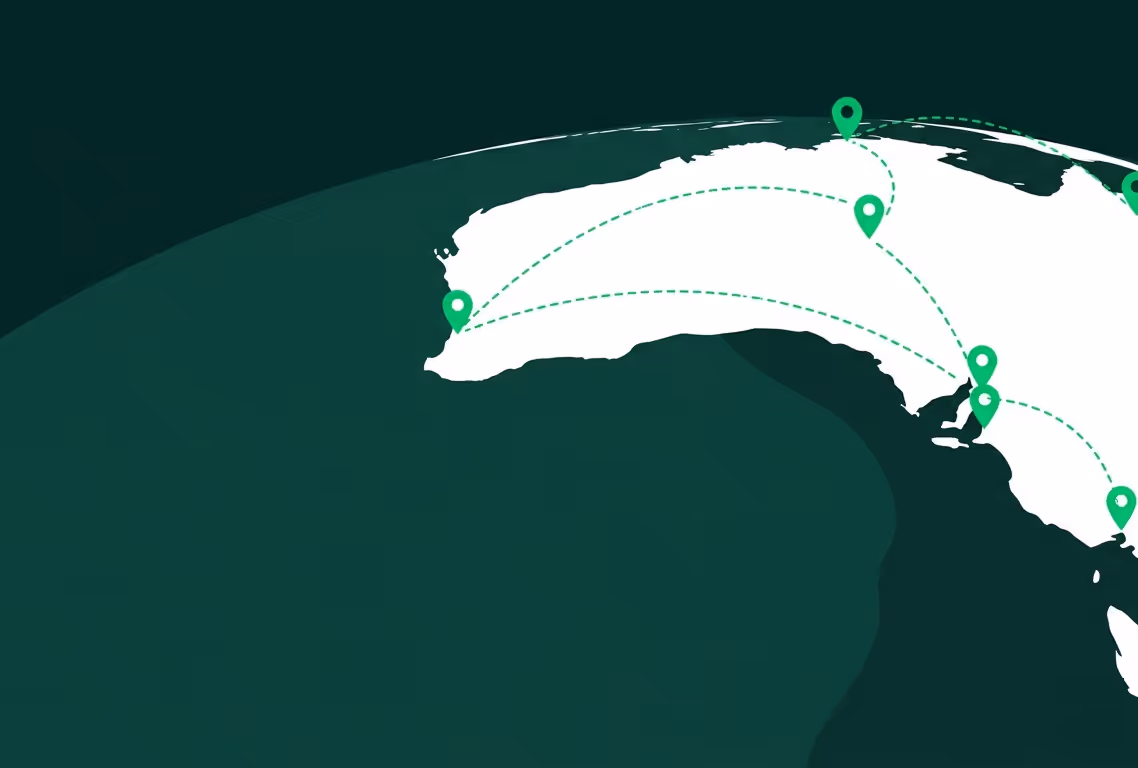
Australian businesses lose an estimated $2 billion in freight every year to damage, loss, and theft, according to a FreightSafe report published in November 2025. It's a number that's been picked up across the industry, but it's rarely visualised. Where does that loss actually happen? Which routes, which regions, which corridors?
Over the last few years we've quietly built one of the largest datasets of domestic freight claims in Australia. Every loss and damage event we've processed. Every origin, every destination, every kilometre travelled.
So we put it on a map.
Explore the freight claims map →
Nearly 30,000 claims. Over 4,200 unique origin-destination pairs. Five years of data across every state and territory. Australian domestic freight only.
You can pan, zoom, and filter by lane, distance, and region. Every line is a real corridor. Every dot is a real claim.
Some of what shows up is what you'd expect. A lot of it isn't.
The corridors carrying the most loss aren't always the ones you'd guess. Distance and risk don't track the way most people assume. And there are pockets of the country lighting up disproportionately, in ways that say something about where Australian freight is actually going wrong.
Have a look at where you operate. Zoom into your major lanes. See where the heat is on the routes you run, and the ones you don't.
If the map raises questions about your own claims profile, get in touch.
FreightInsure is Australia and New Zealand's embedded freight insurance platform. We work with carriers, 3PLs, brokers and TMS platforms to embed per-shipment cover at the point of dispatch.
Industry Insights
Industry Insights

Company News